This has not been proof-read or modified for simpler reading yet.
12/23/24
Getting Started
These are my notes from the ROS2 Perception course available on The Construct. Since this is a robotics note, you will need a physical robot to follow along. I am using the simulator on the website to interact with the tech stack.
This note will cover:
- Integrating and processing sensor data in ROS2
- Implementing image processing algorithms using OpenCV
- Working with Point Cloud Data and Point Cloud Library (PCL)
- Exploring human-robot interaction with face detection and recognition
- Applying AI perception techniques using deep learning frameworks
Sensor Data
Sensors make up robotics, and it's important to understand how they work and how to work with them. As robots have various sensors, our goal is to utilize them in order to apply perception and decision making algorithms. Therefore, combining information from multiple sensors such as cameras, LIDAR, radar, and other specialized devices can help us construct a more detailed and accurate representation of the environment that'll aid us in our algorithms.
In ROS2, there are different kinds of messages that help robots understand the world. The three main messages though are:
sensor_msgs/LaserScan- Maps out surroundings using LIDAR which gives robot the ability to localize themselves and avoid collisionssensor_msgs/Image- Captures images with a camera and helps in recognizing objects via computer vision.sensor_msgs/PointCloud2- Captures detailed information about shapes and structures in the environment to create 3D maps.
Laser Messages
The sensor_msgs/LaserScan is a standard message type commonly used for representing laser scan data generated by laser range finders or LIDAR sensors. Laser scan data represents the distance measurements captured by a LIDAR. More information can be found on the official documentation
There are other fields but the most important ones are:
angle_minandangle_max- represents minimum and maximum angles of the laser scan, which defines the angular range over which the laser sensor collected dataangle_increment- specifies the angular distance between consecutive measurements in the scan and helps to determine the angular resolution of the sensor.range_minandrange_max- defines the minimum and maximum range of the sensorrange- an array containing the measured distances from the sensor to objects in its field of view where each element corresponds to a specific angle within the angular ranged defined by theangle_min,angle_max, andangle_increment.intensities- an array that provides intensity information along with range data. (THis could be empty as not all laser scanners provide intensity data)
Image Messages
The sensor_msgs/Image is another standard message type used for representing images. Images captured by sensors such as cameras are represented as a grid of pixels where each pixel contains information about its color and intensity. The grid is a compactly encoded one dimensional array that's stored in the data field. More can be found here
The most important ones are:
-
heightandwidth- represents the dimensions of the image. Height = rows, width = columns -
encoding- represents the format used to represent the image data. Commmon encodings are below: -
bgr8- 8-bit BGR (Blue-Green-Red) encoding where each pixel is represented by three bytes
-
rgb8- 8-bit RGB (Red-Green-Blue) encoding similar tobgr8but with a different byte order
-
mono8- 8-bit grayscale encoding, wehre each pixel is represented by a single byte indicating its intensity
-
step- specifies the number of bytes occupied by each row of the image data (row length) in bytes. The formula would thus be byte_depth * row length (width) = step. -
data- contains the raw image data and is represented as an array of bytes, not pixels where each byte represents a component of the image data according to the specified encoding.
Images generally use the top left corner of an image as the origin (0.0). This aligns with computer graphic standards and is the usual convention. Also note that the values of each color component ranges from 0 to 255, with 0 being no color and 255 representing maximum intensity.
The data for the above grid would be: data = [ B1, G1, R1, B2, G2, R2, B3, G3, R3, B4, G4, R4] since it uses bgr8
Point Cloud Messages
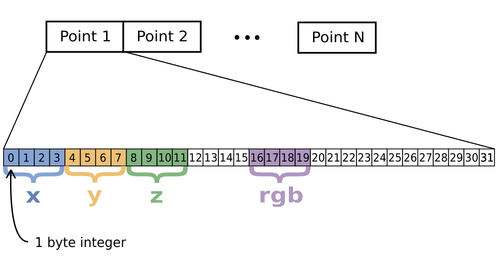
The sensor_msgs/PointCloud2 is a common data structure used to represent 3D point cloud data. Point clouds are collections of points in 3D space and are captured b y sensors such as 3D LIDARS or depth cameras. It consists of a collection of points in 3D space, each point having attributes such as its X, Y, and Z coordinates, intensity, color, or other relevant info. More info can be found here
The most important fields are:
heightandwidth- represents the dimensions of the point cloud. Total number of points is height * widthfields- describes the individual data fields associated with each point, such as x, y, z coordinates, intensity, colors, etc. Specifies what attributes each point has.point_step- represents the size of each point in bytesrow_step- length of a row in bytesdata- represents the raw binary data containing the point cloud and is 1D array. (Binary Format and size is row_step x height)is_dense- boolean indicating if the point if dense or sparse
A sample PointCloud2 message:
- 0
- 0
- '...'
is_dense: true
---
header:
  stamp:
    sec: 414
    nanosec: 253000000
  frame_id: deepmind_robot1_camera_depth_optical_frame
height: 1
width: 307200
fields:
- name: x
  offset: 0
  datatype: 7
  count: 1
- name: y
  offset: 4
  datatype: 7
  count: 1
- name: z
  offset: 8
  datatype: 7
  count: 1
- name: rgb
  offset: 16
  datatype: 7
  count: 1
is_bigendian: false
point_step: 32
row_step: 9830400
data:
- 20
- 159
- 146
- 191
Given the following specifications:
point_step= 32fields-
x- (offset = 0, datatype = 7)
-
y- (offset = 4, datatype = 7)
-
z- (offset = 8, datatype = 7)
-
rgb- (offset - 16, datatype = 7)
Datatype = 7 denotes float32. The bytes 12 to 15 are unused as well as the bytes after 19 until the end of the 32-byte point representation. This repeats for each point in the point cloud data.
Point Cloud Marker written by The Construct
import rclpy
from rclpy.node import Node
from sensor_msgs.msg import PointCloud2
from visualization_msgs.msg import Marker, MarkerArray
from geometry_msgs.msg import Point
import struct
from typing import List

class PointCloudMarker(Node):

    def __init__(self) -> None:
        super().__init__('point_cloud_marker')
        self.subscription = self.create_subscription(
            PointCloud2,
            '/deepmind_robot1_depth_sensor/points',
            self.point_cloud_callback,
            10)
        self.marker_publisher = self.create_publisher(MarkerArray, 'visualization_marker_array', 10)

    def point_cloud_callback(self, msg: PointCloud2) -> None:

        # Extract points from the point cloud message uniformly
        points = self.extract_points(msg)

        # Create markers for the extracted points
        marker_array = self.create_markers(msg, points)

        # Publish the marker array
        self.marker_publisher.publish(marker_array)

    def extract_points(self, msg: PointCloud2) -> List[Point]:
        """Extract points uniformly from the point cloud message"""
        points = []
        num_points = 50
        step_size = len(msg.data) // num_points  # Divide the data into 50 equal parts

        for i in range(0, len(msg.data), step_size):
            if len(points) >= num_points:
                break

            index = i
            x = self.read_float32(msg.data, index)
            y = self.read_float32(msg.data, index + 4)
            z = self.read_float32(msg.data, index + 8)
            p = Point()
            p.x, p.y, p.z = x, y, z
            points.append(p)

        return points

    def create_markers(self, msg: PointCloud2, points: List[Point]) -> MarkerArray:
        """Create markers for the extracted points"""
        marker_array = MarkerArray()
        for idx, point in enumerate(points):
            marker = Marker()
            marker.header = msg.header
            marker.type = Marker.SPHERE
            marker.action = Marker.ADD
            marker.scale.x = 0.1
            marker.scale.y = 0.1
            marker.scale.z = 0.1
            marker.color.r = 1.0
            marker.color.a = 1.0
            marker.pose.position = point
            marker.id = idx
            marker_array.markers.append(marker)

        return marker_array

    def read_float32(self, data: bytes, index: int) -> float:
        """Helper function to read float32 from byte array"""
        return struct.unpack_from('f', data, index)[0]

def main(args=None) -> None:
    rclpy.init(args=args)
    point_cloud_marker = PointCloudMarker()
    rclpy.spin(point_cloud_marker)
    point_cloud_marker.destroy_node()
    rclpy.shutdown()

if __name__ == '__main__':
    main()
Image Processing
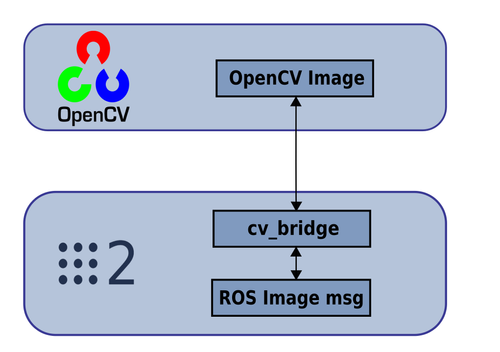
Image processing is used to improve the quality of an image or extract useful information from it. This part will use OpenCV and cv_bridge to for efficient conversion/integration between ROS2 messages and OpenCV images.
OpenCV
If you don't know what OpenCV is, then you definitely need to read up on it. It's the premise for all computer vision things. It's an open source computer vision and machine learning software library that provides an infrastructure for computer vision applications. You can do various things such as image recognition, object detection, facial recognition, and video tracking.
Here are some of the features OpenCV provides:
- Filtering - Offers filters such as Gaussian blur, median blur, and bilateral filter for noise reduction and image smoothing.
- Feature Extraction - Offers algorithms like SIFT, SURF, and ORB for feature extraction and keypoint detection which are crucial for tasks like object recognition and tracking.
- Object Detection - Has pretained models and algorithms such as Haar cascades, HOG descriptors, and deep learning based methods for object detection and classification.
OpenCV functions can be directly applied to the image data extracted from sensor_msgs/Image which makes it easy to use in ROS2 projects.
cv_bridge
Before using OpenCV functions, image data needs to be converted from the ROS2 message format to a format compatible with OpenCV. This is done through the cv_bridge package, which converts between ROS2 image messages (sensor_msgs/Image) and OpenCV data structures (cv::mat). This allows developer to focus on the actual development instead of the conversion and integration of different tools.
Color Spaces
A color space is a mathematical model that describes how colors can be represented as tuples of numbers, typically as coordinates or vectors in a multidimensional space. Different colors have different purposes and each have their tradeoffs depending on the problem at hand.
Some important color spaces:
- RGB (Red, Green, Blue)
- HSV (Hue, Saturation, Value)
- HSL (Hue, Saturation, Lightness)
- YUV/YCbCR (Luma, Chroma)
- LAB (CIELAB)
Choosing the right color space can impact the success and efficiency of our image processing algorithms. As developers always say, choose the right tool for the job.
RGB vs HSV
RGB is one of the most common colors used in digital imaging and as the acronym suggests, it stands for (Red, Green, Blue). Each value ranges from 0 to 255 and represents the intensity of each color channel. Generally, RGB is great at representing colors on electronic displays and digital cameras.
HSV is an alternative color space which uses (Hue, Saturation, and Value). Hue represents the type of color (red, green, blue) and is measured in degrees on a color wheel. Saturation determines the intensity or the purity of the color. Higher saturation values indicates more vivid colors. Value represents the brightness or intensity of the color. HSV is designed to more closely align with how humans perceive and describe colors.
Advantages of HSV over RGB for Image Processing
HSV is often preferred over RGB in color segmentation which is when we identify specific objects or regions of interests in an image. The HSV color space simplifies the process of defining color ranges and thresholds for segmentation. This is because thresholding based on hue and saturation help isolate specific colors or color ranges while minimizing the impact of variations in lighting conditions.
HSV is also more robust to changes in lighting conditions compared to RGB. Decoupling color information from brightness (value) allows us to handle different variations in illumination without affecting color perception.
Blob Tracking
Blob tracking is a technique used to detect and track regions of interests (blob) in a sequence of images or frames in a video stream. A blob typically represents a group of connected pixels with similar properties, such as color, intensity, or texture.
Blob Tracker Node
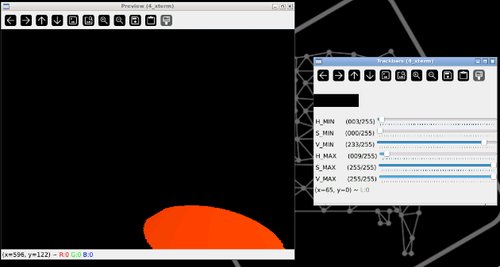
The simulation goal is for our robot to detect orange blobs which is situated at the exit. This allows our robot to navigate towards the exit.
We need to create two things:
- blob_point_pub.py - Detect blob and publish the position
- blob_tracker.py - Guide the robot towards the exit door
We have to first isolate out the blob which requires filtering based on HSV color. The simulation provides us some fancy code that allows us to isolate the HSV.
We can then proceed to create our two necessary files.
- blob_point_pub.py
- blob_tracker.py
import rclpy
from rclpy.node import Node
from sensor_msgs.msg import Image
from geometry_msgs.msg import Point
import cv2
import numpy as np
from cv_bridge import CvBridge
from typing import List, Tuple

class BlobPointPublisher(Node):
def **init**(self) -> None:
super().**init**('blob_point_publisher')
self.subscription = self.create_subscription(
Image,
'/deepmind_robot1/deepmind_robot1_camera/image_raw',
 self.image_callback, 10)
self.publisher = self.create_publisher(Point, '/point_blob', 10)
self.cv_bridge = CvBridge()

    def image_callback(self, msg: Image) -> None:
        try:
            # Convert ROS Image message to OpenCV format
            cv_image = self.cv_bridge.imgmsg_to_cv2(msg, desired_encoding="bgr8")
        except Exception as e:
            self.get_logger().error("Error converting ROS Image to OpenCV format: {0}".format(e))
            return

        # Convert BGR image to HSV
        hsv_image = cv2.cvtColor(cv_image, cv2.COLOR_BGR2HSV)

        # Define lower and upper bounds for orange color in HSV
        lower_orange = np.array([3, 0, 233])
        upper_orange = np.array([9, 255, 255])

        # Create a binary mask for orange color
        mask = cv2.inRange(hsv_image, lower_orange, upper_orange)

       # Draw coordinate frame
        self.draw_frame(cv_image)

        # Find contours in the mask
        contours, _ = cv2.findContours(mask, cv2.RETR_EXTERNAL, cv2.CHAIN_APPROX_SIMPLE)

        # Draw a red circle around the blob contour
        for contour in contours:
            self.draw_blob_contour_circle(cv_image, contour)

        # If no contours are found, return
        if not contours:
            return

        # Find the largest contour
        blob_contour = max(contours, key=cv2.contourArea)

        # Calculate centroid of the contour
        moment = cv2.moments(blob_contour)
        if moment["m00"] != 0:             # Area of the object
            blob_x = float(moment["m10"] / moment["m00"])  # x-coordinate of centroid
            blob_y = float(moment["m01"] / moment["m00"])  # y-coordinate of centroid

            # x and y coordinates of the blob are computed relative to the center of the image
            x, y = self.get_blob_relative_position(cv_image, blob_x, blob_y)

            # Publish Blob
            self.publish_blob(x, y)

            # Draw detected blobs
            self.draw_keypoints(cv_image, [(blob_x, blob_y)])

        # Display the image (optional)
        cv2.imshow("Image", cv_image)
        cv2.waitKey(1)

    def draw_frame(self,
                image: np.ndarray,
                dimension=0.1,      #- dimension relative to frame size
                line=2              #- line's thickness
        ) -> None:
        """ Draw X Y coordinate frame at the center of the image"""

        rows = image.shape[0]
        cols = image.shape[1]
        size = min([rows, cols])
        center_x = int(cols/2.0)
        center_y = int(rows/2.0)

        line_length = int(size*dimension)

        #-- X
        image = cv2.line(image, (center_x, center_y), (center_x+line_length, center_y), (0,0,255), line)
        #-- Y
        image = cv2.line(image, (center_x, center_y), (center_x, center_y+line_length), (0,255,0), line)


    def draw_blob_contour_circle(self, img: np.ndarray, contour: np.ndarray) -> None:
        """ Draw a red circle around the detected blob """
        # Get the bounding rectangle of the contour
        x, y, w, h = cv2.boundingRect(contour)

        # Calculate the center of the rectangle
        center_x = x + w // 2
        center_y = y + h // 2

        # Calculate the radius of the circle based on the contour size
        radius = max(w, h) // 2

        # Draw a red circle around the center
        cv2.circle(img, (center_x, center_y), radius, (0, 0, 255), 2)


    def get_blob_relative_position(self, image: np.ndarray, x: float, y: float) -> Tuple[float, float]:
        """ Get blob position relative to the coordinate frame placed at the center of the image"""
        # The shape attribute of a NumPy array returns a tuple representing the dimensions of the array.
        # For an image, the shape tuple consists of 3 elements: (height, width, channels).

        rows = float(image.shape[0]) # height
        cols = float(image.shape[1]) # width

        #  Coordinates of the center of the image
        center_x    = 0.5*cols
        center_y    = 0.5*rows

        # The x and y coordinates of the keypoint are computed relative to the center of the image
        x = (x - center_x)/(center_x)
        y = (y - center_y)/(center_y)

        return x,y

    def publish_blob(self, x: float, y: float) -> None:
        """ Publish the blob position to /point_blob """
        # Create a Point message
        point_msg = Point()
        point_msg.x = x
        point_msg.y = y

        # Publish the Point message
        self.publisher.publish(point_msg)


    def draw_keypoints(self, img: np.ndarray, keypoints: List[Tuple[float, float]]) -> None:
        """ Draw the detected blob keypoints in red """
        # Draw red circles at the detected blob keypoints
        for kp in keypoints:
            # Convert keypoints to integers
            kp = (int(kp[0]), int(kp[1]))
            cv2.circle(img, kp, 5, (0, 0, 255), -1)

def main(args=None) -> None:
rclpy.init(args=args)
blob_point_publisher = BlobPointPublisher()
rclpy.spin(blob_point_publisher)
blob_point_publisher.destroy_node()
rclpy.shutdown()

if **name** == '**main**':
main()
import rclpy
from rclpy.node import Node
from geometry_msgs.msg import Point, Twist

class BlobTracker(Node):
    def __init__(self) -> None:
        super().__init__('blob_tracker')
        self.subscription = self.create_subscription(
            Point,
            '/point_blob',
            self.blob_callback,
            10)
        self.publisher = self.create_publisher(Twist, '/cmd_vel', 10)

        self.angular_gain = 0.3
        self.no_blob_detected = True
        self.timer = self.create_timer(1.0, self.rotate_continuous)

    def blob_callback(self, msg: Point) -> None:
        # Extract blob coordinates
        blob_x = msg.x
        blob_y = msg.y

        # Define linear velocity
        linear_x = 0.3

        if blob_x != 0.0 or blob_y != 0.0:
            # Adjust angular velocity based on blob's position
            angular_vel = -self.angular_gain * blob_x
            # Clip angular velocity to [-1, 1] range
            angular_vel = max(min(angular_vel, 1.0), -1.0)

            # Adjust linear velocity based on blob's position
            if blob_y < 0.8:
                linear_vel = linear_x
            else:
                linear_vel = 0.0  # Stop the robot
            self.no_blob_detected = False
        else:
            return

        self.pub_velocities(linear_vel, angular_vel)

    def rotate_continuous(self) -> None:
        # Rotate continuously
        if self.no_blob_detected:
            twist_msg = Twist()
            twist_msg.angular.z = 0.3  # Adjust angular velocity as needed
            self.publisher.publish(twist_msg)
            self.get_logger().warn("No blobs detected yet ... Rotating continuously")

    def pub_velocities(self, linear: float, angular: float) -> None:
        # Create Twist message with linear and angular velocities
        twist_msg = Twist()
        twist_msg.linear.x = linear
        twist_msg.angular.z = angular

        # Publish the Twist message
        self.publisher.publish(twist_msg)
        self.get_logger().info(f"Linear vel: {linear:.2f}, Angular vel: {angular:.2f}")


def main(args=None) -> None:
    rclpy.init(args=args)
    blob_tracker = BlobTracker()
    rclpy.spin(blob_tracker)
    blob_tracker.destroy_node()
    rclpy.shutdown()

if __name__ == '__main__':
    main()